

Global Bill of Lading Database Providers: Essential Sources for Worldwide Trade Data
2026-09-17
Ask any trade analyst what actually moves a market, and they'll point to the paperwork most people never see: the bill of lading. These records aren't just proof of shipment—they're a live feed of who's buying, who's selling, and where goods are heading. The challenge is turning that raw data into decisions. That's where global bill of lading database providers come in, and few tools handle this as cleanly as Tendata. In this guide, we break down the essential sources for worldwide trade data, so you can stop guessing and start mapping real trade flows.
Decoding the Paper Trail Behind Ocean Freight
The stack of documents that follows a container from origin to destination often outweighs the cargo in complexity. A bill of lading is not just a receipt; it is a title document that can be bought, sold, or used as collateral while the ship is still at sea. Missing a single endorsement or misstating a shipper's name can turn a routine discharge into a week-long hold at the terminal.
Beneath the bill of lading sits a supporting cast: commercial invoices, packing lists, certificates of origin, and dangerous goods declarations. Each one answers a different question for a different party. Customs wants to know what the goods are worth and where they were made. The carrier wants to know how much volume they occupy and whether they pose a risk. The bank financing the transaction wants proof that the goods actually exist and are on the move.
The real skill in decoding the paper trail is understanding how one document changes another. A packing list that says '40 packages' while the bill of lading says '1 pallet' triggers an automatic mismatch, even if the physical cargo is identical. Experienced freight forwarders read the trail like a story, checking for contradictions before they become demurrage charges.
Commercial Databases That Turn Manifests into Market Intelligence
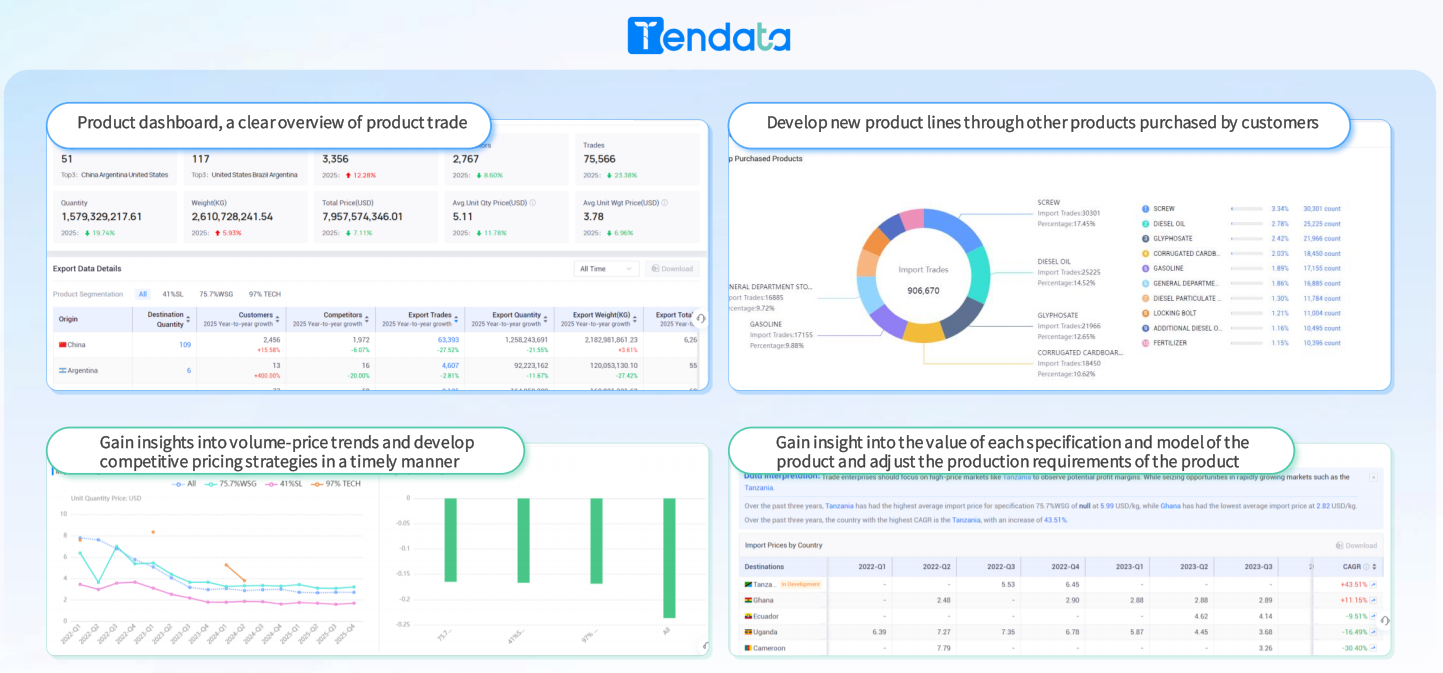
Commercial databases rarely get credit for the heavy lifting they do behind the scenes. A shipment manifest might look like a dull stack of names, weights, and ports, but once it enters a well-structured commercial platform, it starts to tell a story. These systems parse bill-of-lading data, customs filings, and trade records, then cross-reference them with company profiles, ownership links, and historical patterns. The result isn't just a cleaner spreadsheet—it's a live picture of who is buying from whom, how often, and at what volume.
The real power lies in the connections that emerge without anyone manually tracing them. A sudden spike in a supplier's outbound containers to a region they've never served before might signal a distribution deal. A drop in shipment frequency between two long-time partners can flag a contract dispute. Commercial databases automate this pattern-spotting, turning raw logistics records into signals that procurement teams, investors, and sales leads can act on. The best platforms don't just store the data; they layer in predictive scoring, anomaly alerts, and buyer-supplier mapping that make the manifest feel almost like a strategic brief.
Of course, the quality of that intelligence depends on the source coverage and how carefully the data is normalized. A database that only captures major carriers will miss regional players. One that doesn't reconcile name variations across languages will create phantom companies. The top commercial systems invest heavily in entity resolution and data cleaning, because a manifest is only as useful as the confidence you have in the match behind it. When that foundation is solid, a simple customs entry can reveal pricing corridors, routing shifts, and emerging trade lanes long before they show up in quarterly reports.
Fields That Actually Matter in a B/L Record
A bill of lading isn’t just a stack of boxes and fine print—some fields actually change how cargo moves, who gets paid, and where liability lands. The shipper and consignee blocks determine custody and release rights, while the notify party often goes unnoticed until the vessel arrives and nobody knows who to call. Port of loading and port of discharge set the scope of the carrier’s responsibility, but the container and seal numbers are the real proof that what was loaded matches what gets delivered.
Beyond those basics, piece count, weight, and measurement are where disputes start. A clerk may copy the packing list without checking the scale, and then a shortage claim turns on whether the carrier recorded “shipper’s load and count” or not. The description of goods is another field worth reading twice: vague wording protects the carrier more than the cargo owner, while precise marks and numbers help avoid customs delays. Freight terms—prepaid or collect—decide who can negotiate release of the goods, and the number of originals controls how many endorsement chains you may have to chase at destination. Even the date and place of issue carry weight, because they anchor the contract of carriage and can affect demurrage or detention calculations.
Practical Uses: Lead Generation, Supplier Checks, and Market Sizing
Finding new customers without cold calling feels like a hack once you realize how much public data is already out there. Instead of buying expensive lead lists, you can pull company details from trade registries, LinkedIn signals, and industry directories, then filter by recent funding, hiring patterns, or new product launches. The real trick is connecting the dots between a company's job postings and their expansion plans—when a mid-sized manufacturer starts hiring for export logistics roles, they're usually ready to talk to new suppliers.
Supplier checks are where this gets surprisingly practical. Beyond the basic “are they registered?” question, you can cross-reference shipment records, port data, and customs manifests to see if a supplier actually ships what they claim. A factory might list five major clients on their website, but import records will show only two have placed orders in the last eighteen months. That gap tells you more than any audit form. Pair that with employee count trends pulled from local business databases, and you can spot suppliers that are quietly downsizing before they miss your deadline.
Market sizing without buying syndicated reports is entirely doable if you know where to look. Government trade statistics, industry association filings, and even satellite imagery of warehouse expansions give you a bottom-up estimate that often beats analyst guesses. For example, if you track the number of active importers in a specific HS code over three years and cross that with average order values from freight forwarders, you get a demand curve grounded in actual transactions. The key is using multiple weak signals—none reliable alone, but together they form a picture that stands up to scrutiny.
Where Free Sources Falter and Paid Data Steps Up
Free datasets often look attractive at first glance, but they come with hidden costs that only surface later. Updates are irregular, coverage is patchy, and the numbers rarely line up when you cross-check them against a second source. In fast-moving industries, that kind of lag turns a useful snapshot into a liability.
Paid data providers close the gap by treating accuracy and freshness as part of the product. Instead of scraping together fragments from public filings or outdated surveys, they maintain dedicated pipelines, run quality checks, and timestamp every release. The difference shows up most clearly when a quarterly report drops or a market shifts overnight, where a stale figure can lead to a bad decision.
There is also the matter of accountability. When a free source breaks or changes its format, you are on your own to fix the mess. With a paid service, support comes with the subscription, and that safety net is often worth more than the price difference.
Beyond Traditional B/L Data: Newer Signals for Trade Tracking
Bill of lading records have long been the backbone of trade tracking, but they only tell part of the story — often with delays, gaps, or outright omissions. Increasingly, analysts are turning to newer signals that bypass paperwork altogether. Satellite imagery of container yards, automatic identification system (AIS) pings from vessels, and even night-time light intensity around manufacturing hubs offer real-time or near-real-time views of cargo movement that no stamped document can match. These sources don't replace B/L data; they fill the blind spots where paperwork lags behind physical reality.
One of the most overlooked signals comes from port congestion metrics derived from vessel dwell times and berth occupancy, which can be cross-referenced with trucking GPS data and chassis availability at inland depots. Another emerging layer involves scraping public procurement notices, utility connection requests for new warehouses, and corporate registry filings in free trade zones. When a company suddenly registers a new logistics subsidiary or applies for a power upgrade at a remote storage facility, it often signals a shift in trade patterns months before any bill of lading is issued.
The real advantage of these newer signals is their ability to reveal what traditional documents deliberately hide. Transshipment hubs, re-invoicing centers, and sanctioned trade routes rarely appear cleanly in B/L data, but they leak through vessel tracking anomalies, empty container repositioning data, and discrepancies between export declarations and import manifests in neighboring countries. By layering these unconventional sources, trade analysts can build a more dynamic, near-real-time map of global commerce — one that catches shifts in sourcing, rerouting, and inventory hoarding well before official statistics catch up.
FAQ
A bill of lading database holds shipment-level records that typically include shipper and consignee names, cargo descriptions, container numbers, ports, and vessel details. Customs data often focuses on tariff codes and duties, while bills of lading reveal the actual parties moving goods between countries. This granularity makes the databases valuable for mapping supply chain relationships.
Several companies have built strong reputations in this space. ImportGenius, Panjiva (now part of S&P Global), Descartes Datamyne, PIERS, and Volza are frequently mentioned. Each has different geographic coverage and user interfaces, so the best fit depends on which trade lanes you need to monitor.
They often obtain data through direct arrangements with customs agencies, port authorities, or logistics networks. Some scrape publicly available filings, while others purchase licensed feeds from carriers or freight forwarders. The collection method heavily influences how complete and timely the dataset is for a given country.
Common uses include competitor shipment tracking, identifying new suppliers or buyers, monitoring commodity flows, and verifying potential trade partners. Logistics firms also use it to find shippers who need freight services, while financial analysts track company-level import/export activity as an early indicator of performance.
Look closely at search filters, alerting options, and how easily you can export data for your own analysis. Historical depth matters too—some providers only keep a few years of records, while others go back a decade or more. Also check whether the provider offers cleaned and standardized company names, because raw data often has messy variations.
Not every country requires public filing of bills of lading, so coverage gaps exist, especially in parts of Africa and the Middle East. Even where data is available, transshipment ports can obscure the true origin or destination. And many shipments move under NVOCC or freight forwarder names, making it harder to identify the actual buyer or seller.
Prices vary widely, from a few hundred dollars per month for limited search access to several thousand annually for enterprise-level API integrations and unlimited exports. Free options like ImportYeti or basic shipment search on some provider sites can give you a taste, but they usually restrict the number of records you can view or the filters you can apply.
Because there is always some delay between vessel departure and data publication, the information is best viewed as a near-real-time indicator rather than a predictive tool. However, spotting a sudden spike in shipments of a particular commodity or from a specific supplier can give analysts an early warning of shifts in demand or sourcing strategies.
Conclusion
The bill of lading sits at the center of every ocean shipment, yet its real value only emerges once the scattered paper and electronic records are pulled into a structure that can be queried. Commercial providers do more than archive these documents—they parse the messy details of manifests and turn them into usable market intelligence. In a typical record, the fields that actually matter are the shipper and consignee names and addresses, notify party, detailed cargo description, HS code, container numbers, weight, voyage, port of lading, and port of discharge. Small inconsistencies in any of these can break a matching algorithm, which is why the strongest databases invest heavily in normalization and entity resolution rather than just raw storage.
That normalized data becomes a practical tool for several jobs at once. A sales team can build prospect lists from recent importers of a given commodity; a compliance group can verify a supplier's shipment history before signing a contract; an analyst can size a regional market by aggregating volumes over time. Free sources do exist, but they usually falter on exactly the dimensions that matter most—coverage outside a few large ports, historical depth, and consistency of company names. Paid platforms close that gap with broader country networks and cleaner matching. Beyond traditional B/L fields, newer signals are also gaining ground: vessel AIS positions, customs summary tables, transshipment hints, and even sustainability-related flags now supplement the core document. Together, these layers let a user move from "what was on this bill" to "what is actually happening in this trade lane."
Contact Us
Contact Person: Grace
Email: [email protected]
Tel/WhatsApp: +86 18721992033
Website: https://www.tendata.com